A Quick Guide for Advanced Features
Contents
- Survey, Campaign, and Distribution
- Survey Rules
- Skip Rules
- Display Rules
- Removal Rules
- Scoring Rules
- A Survey in Multiple Languages
- An Example Survey for Analysis
- Questions and Data Types
- Compare Responses
- Analyze Your Survey
- Understand Your Data First
- Cross Tabulation
- Independent Samples Student's T Test
- Chi-Square Test of Independence
- One-Way ANOVA
- Regression
- Data Export
- We Can Help
In this guide, we only explain some key concepts and demonstrate advanced features. Throughout our website,
most pages have "Read this first", instructional text, and additional tool tips wherever you find this icon ![]() .
The FAQ page has answers to many questions. Please look at these places for anything not covered here.
.
The FAQ page has answers to many questions. Please look at these places for anything not covered here.
Survey, Campaign, and Distribution
We've made great efforts to give survey creators maximum flexibility in handling their surveys and results. At AllCounted, a survey is considered intellectual work, which is basically a list of questions. The first step in making a survey available to participants is creating a campaign. A campaign decides when a survey is live and who can take it. Once a survey becomes live, you need to choose how to distribute your survey to people, and the options include web links, emails, Facebook links, and embedding in a website. This three-level survey-campaign-distribution structure creates maximum flexibility in targeting survey participants and analyzing responses.
A survey can have multiple campaigns that target the same or different groups of people at the same or different times. Each campaign can have multiple distributions to one or more groups of participants. We let you organize survey data at the survey, campaign, or distribution level to analyze survey responses separately, as a whole, or in any possible combination. Additionally, you can compare results between campaigns or distributions through cross tabulation.
For greater flexibility, we allow you to put certain survey responses into one or more labeled groups, which we call an Analysis Group. With this tool, you can analyze results by group, or you can even compare results between groups through cross tabulation.
Another benefit of campaigns, distributions, and analysis groups is that they can be used as data groups (samples or datasets) in statistical analysis. When a statistical tool needs more than one data group, you can use not only the answer choices of a Multiple Choice question to split responses and create groups, but also campaigns, distributions, or analysis groups. Moreover, campaigns, distributions, and analysis groups can be treated as a categorical variable used in a Chi-Square test of independence and other statistical tests.
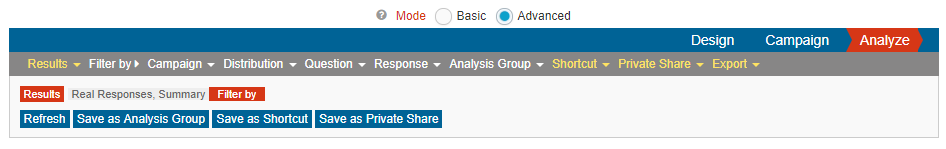
In addition to campaigns, distributions, and analysis groups, you can always use individual questions and information about responses as conditions to slice and dice responses into whatever datasets you'd like for analysis (Tip: You can use an Analysis Group or a Shortcut to remember a desired dataset). All these conditions are collectively called Filters. The following screenshot shows these filters:
Survey Rules
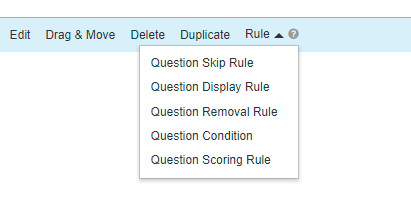
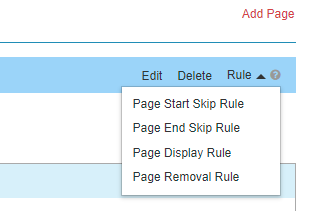
Regarding the logic in a survey, we offer question-level and page-level rules. At the question level, you can have question skip rules, question removal rules, question conditions, and question scoring rules. At the page level, you can have page start skip rules, page end skip rules, and page removal rules. Collectively, they are called survey rules. The screenshots below show where to find them:
Here is what you need to know in order to use survey rules correctly:
- A question skip rule redirects a participant to a later page or a question on a later page based on the answer to a question.
- A question display rule can display or hide a question or the answer choices of a multiple choice question on the same page. It can also display or hide a later page, a question on a later page, or answer choices on a later page.
- A question condition allows you to define a situation based on how a question is answered.
- A question scoring rule allows you to assign a score to the answer of a question. Our system is able to sum the scores on each question in a survey to form the total score of a survey response.
- A page rule allows you to combine question conditions to build a page skip rule or page removal rule. A page rule is able to combine the conditions of multiple questions on the same page or different pages, which makes page rules very powerful. You must create related question conditions before creating a page rule.
- A question removal rule or page removal rule can remove a later page or a question on a later page from display. It can also just remove the answer choices of a multiple choice question instead of removing the whole question.
- Skip rules are tested in the order of page start skip rules, question skip rules, and page end skip rules. If one skip rule is satisfied, then all remaining rules are ignored.
- Skip rules are only useful when a survey has multiple pages. Skip rules are tested only when a page is submitted, and they are unable to skip the questions on the same page. They can only skip a later page or the questions on a later page.
- When multiple display rules are applicable to the same page, question, or answer choice, the most recent rule will decide whether to display or hide the page, question, or answer choice. The execution order of display rules matters.
- All question removal rules and page removal rules on a page are tested when the page is submitted. Their sequence doesn't matter. Removal rules are unable to remove the questions on the same page. They can only remove a later page or the questions on a later page.
- You can create multiple skip rules, removal rules, conditions, or scoring rules for a single question. You can also create multiple page skip rules or page removal rules for a single page.
Skip Rules
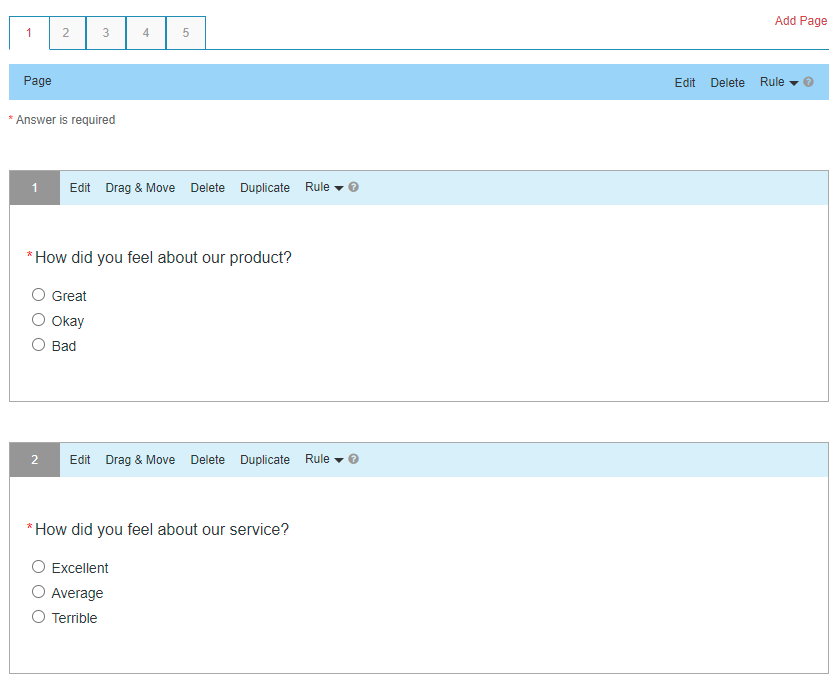
Here is an example to demonstrate the use of skip rules. In this example, you want to conduct a survey with five pages of questions about how customers feel about your product and service. Suppose that the first page has the following two multiple choice questions and answer choices:
Question 1 How did you feel about our product?
- Great
- Okay
- Bad
Question 2 How did you feel about our service?
- Excellent
- Average
- Terrible
Suppose that you want to implement the following skip rules in this sequence:
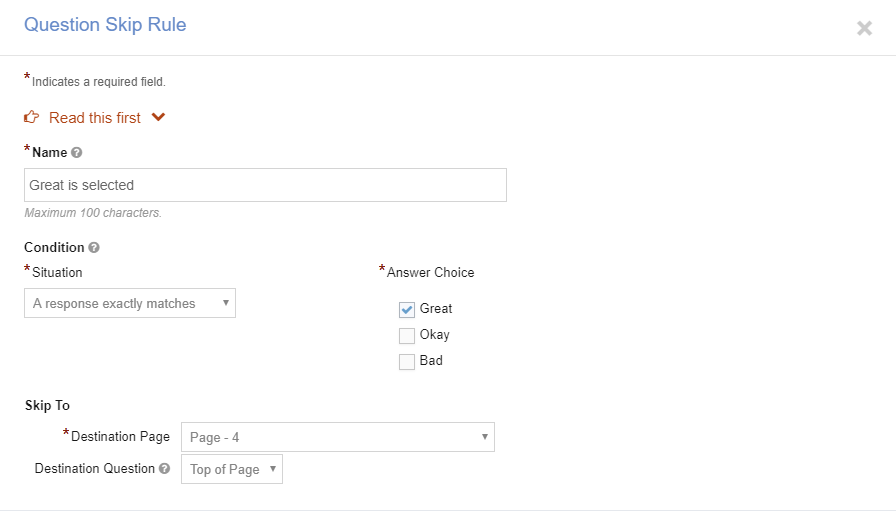
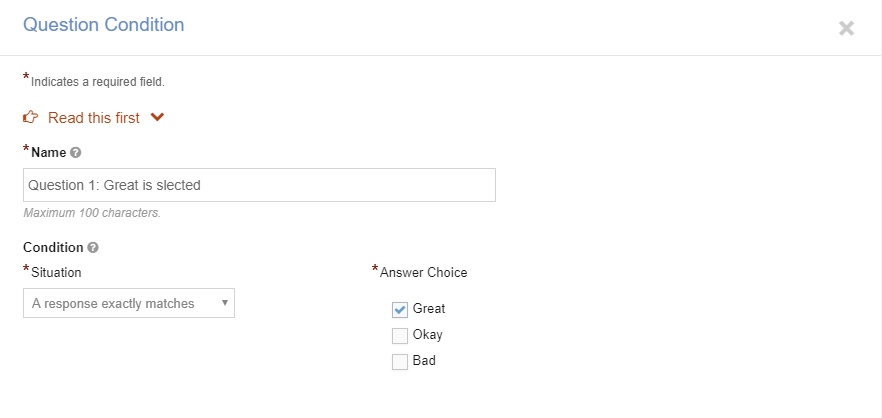
- If a participant selects Great for the product question and Excellent for the service question, then the survey skips to Page 3
- If a participant selects Great for the product question, then the survey skips to Page 4
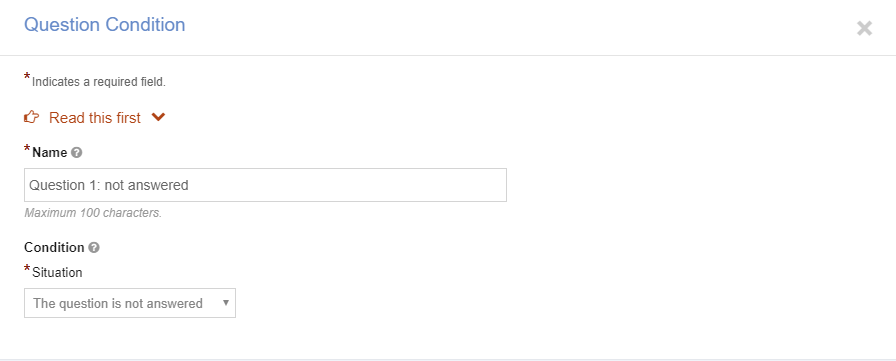
- If a participant doesn't select anything for the two questions, then the survey ends
You can achieve the above design by following these steps. First, you must create one skip rule and two conditions on Question 1:
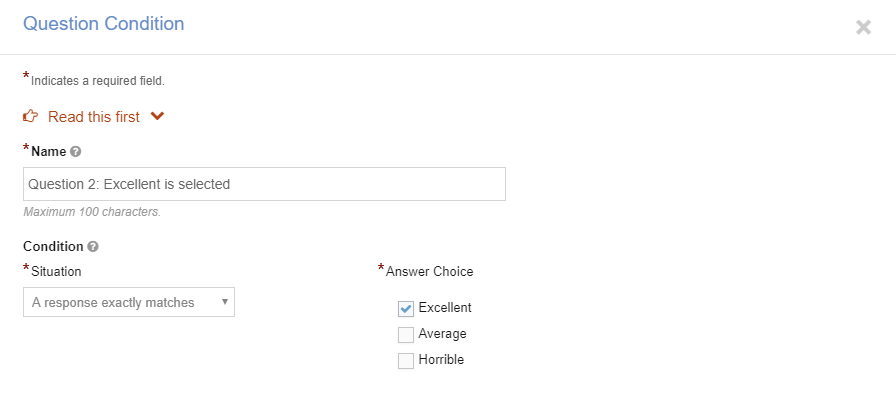
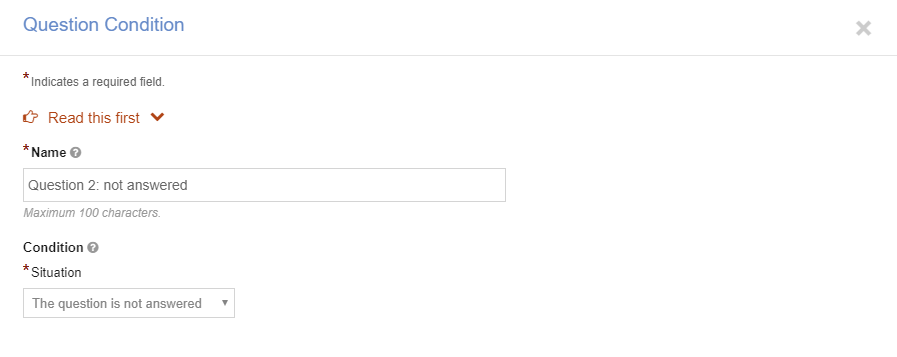
Second, create two conditions on Question 2:
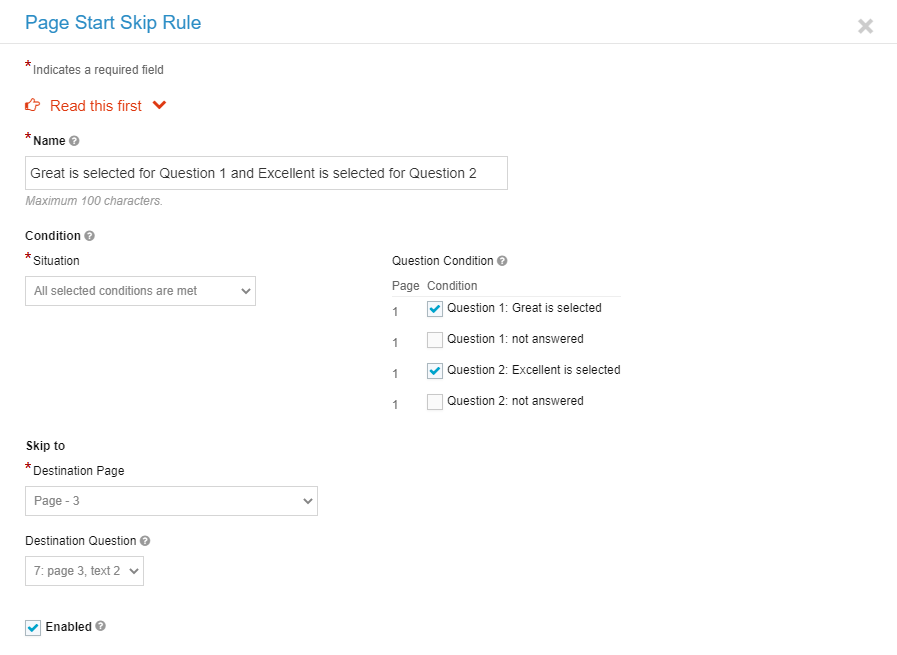
Third, create a page start skip rule:
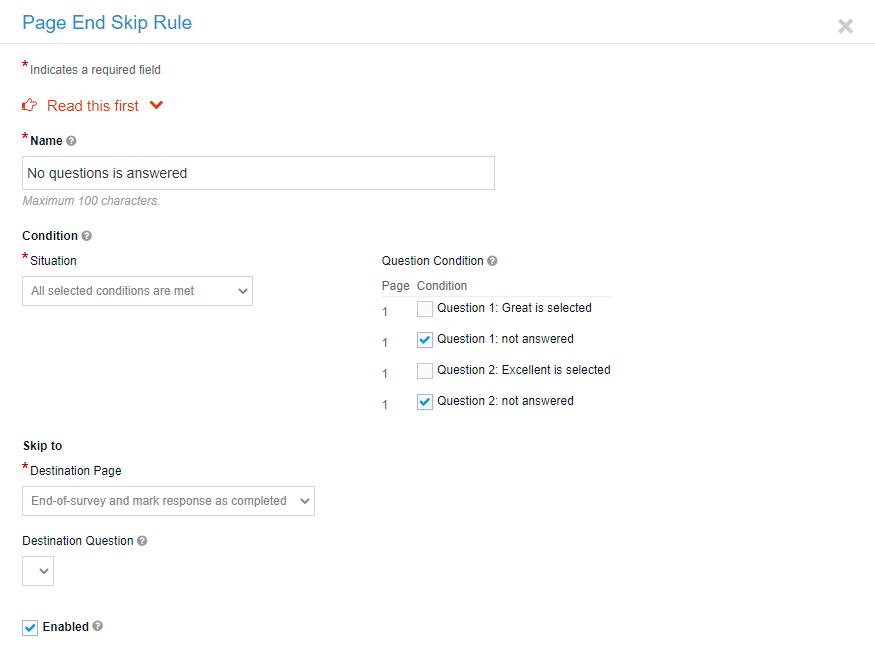
Fourth, create a page end skip rule:
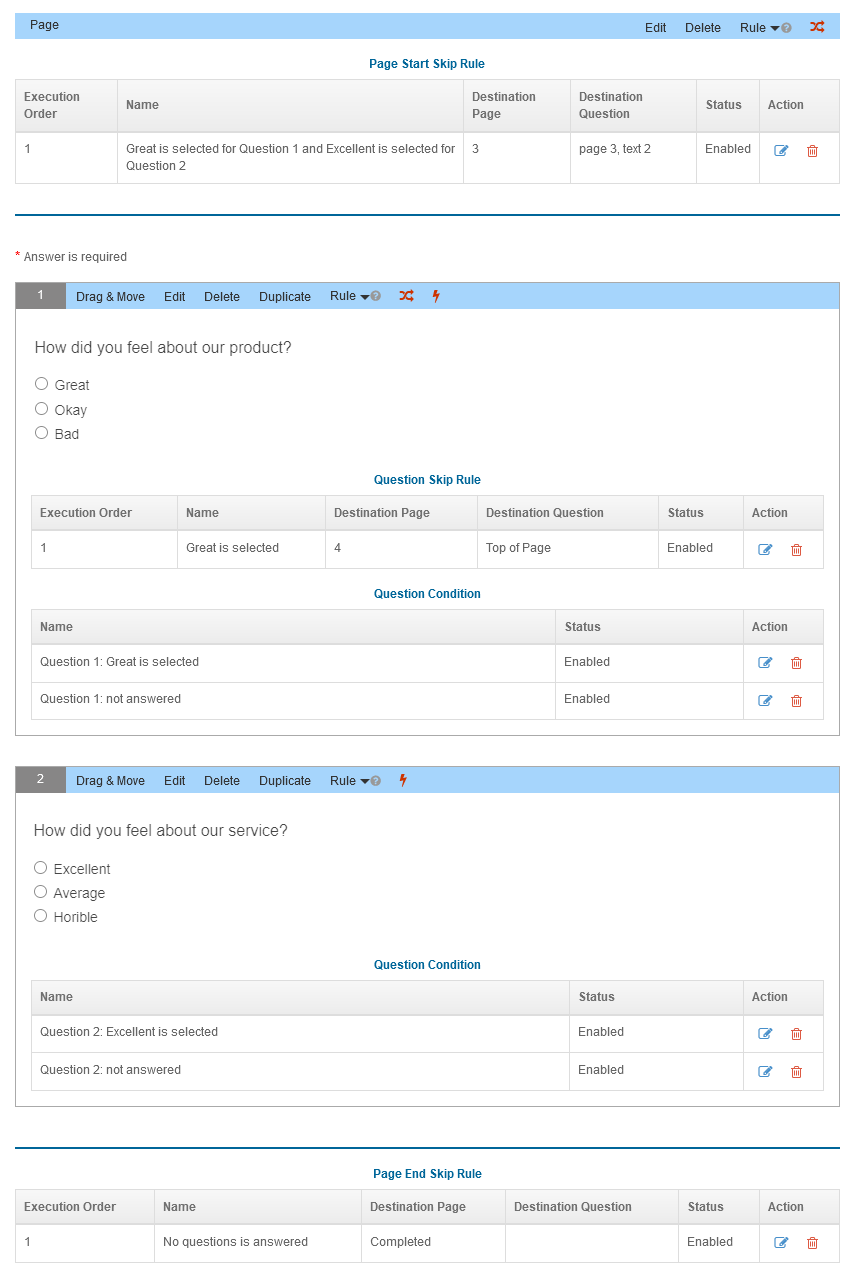
Here's how the page looks when you are done with the above steps:
Following the steps above will achieve your design because page start skip rules are tested before question skip rules, and question skip rules are tested before page end skip rules. We recommend that you add skip rules after you have designed and ordered all the questions and pages properly, and we also recommend that you always test skip rules before asking participants to take your survey.
Display Rules
A display rule can display or hide pages, questions, or answer choices of a multiple choice question. Both question display rules and page display rules can display or hide later pages, questions on later pages, or answer choices on later pages. Only question display rules can display or hide questions or the answer choices of a multiple choice question on the same page. A hidden page will be skipped in a survey.
The execution order of display rules matters. When multiple display rules are applicable to the same page, question, or answer choice, the most recent rule will decide whether to display or hide the page, question, or answer choice.
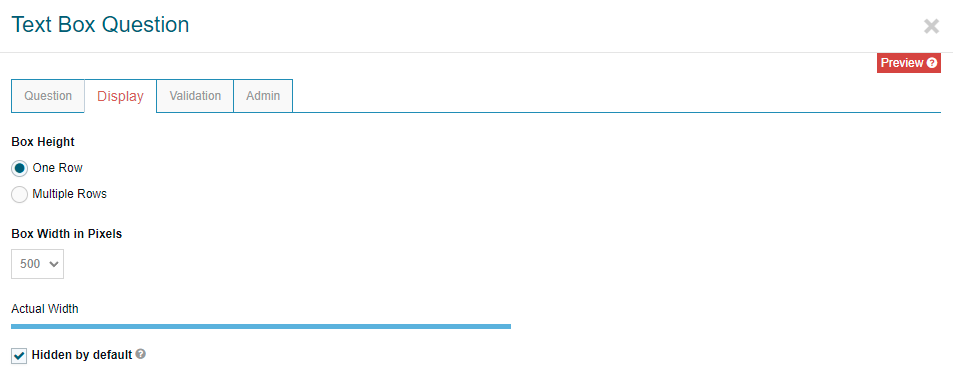
Pages, questions, or answer choices of a multiple choice question are displayed in a survey by default. You can hide them through display rules. On the other hand, you can also make them hidden by default and display them through display rules. The following screen shows how to make a Text Box question hidden by default:
Creating display rules is similar to creating skip rules. The difference is that for a display rule, you have to specify whether the rule is to display or hide a page, question, or answer choice. Here is an example of how to use display rules. Suppose that the second page of the survey mentioned above has the following three questions:
Question 3 Which drink do you like most?
- Coca-Cola
- Pepsi
Question 4 Please explain why you like Coca-Cola most.
Question 5 Please explain why you like Pepsi most.
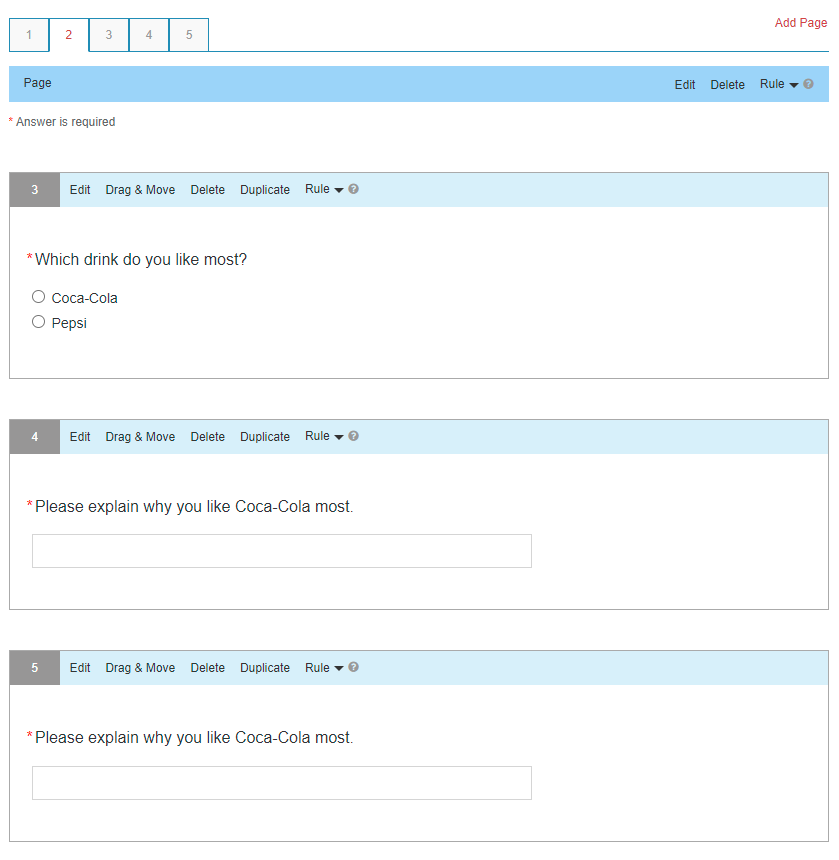
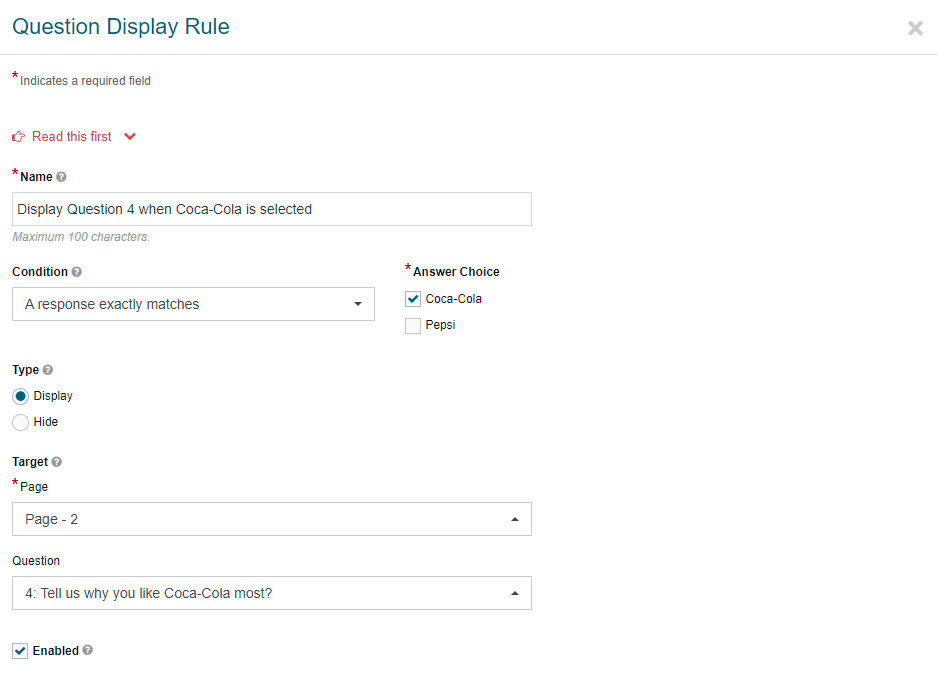
Suppose that you want to show Question 3 only, hide Questions 4 and 5, and display Question 4 or 5 only when a corresponding drink is selected in Question 3. You can achieve this design by hiding Questions 4 and 5 as explained above and then adding two display rules to Question 3 (one for Coca-Cola and one for Pepsi) that would display Question 4 or 5 based on the answer to Question 3. The following screenshot shows the display rule for selecting Coca-Cola as the most liked drink.
Note that you can also achieve your design by displaying Questions 4 and 5 and adding two display rules to Question 3 that would hide Question 4 or 5 depending on which drink is selected in Question 3.
Removal Rules
Removal rules are similar to skip rules, and the difference is that removal rules only remove specified pages or questions from display and they don't skip other pages or questions between the current page and the page or question to remove. Suppose that the following question is on Page 5 of the above survey.
Did you enjoy shopping in our store?
- Yes
- No
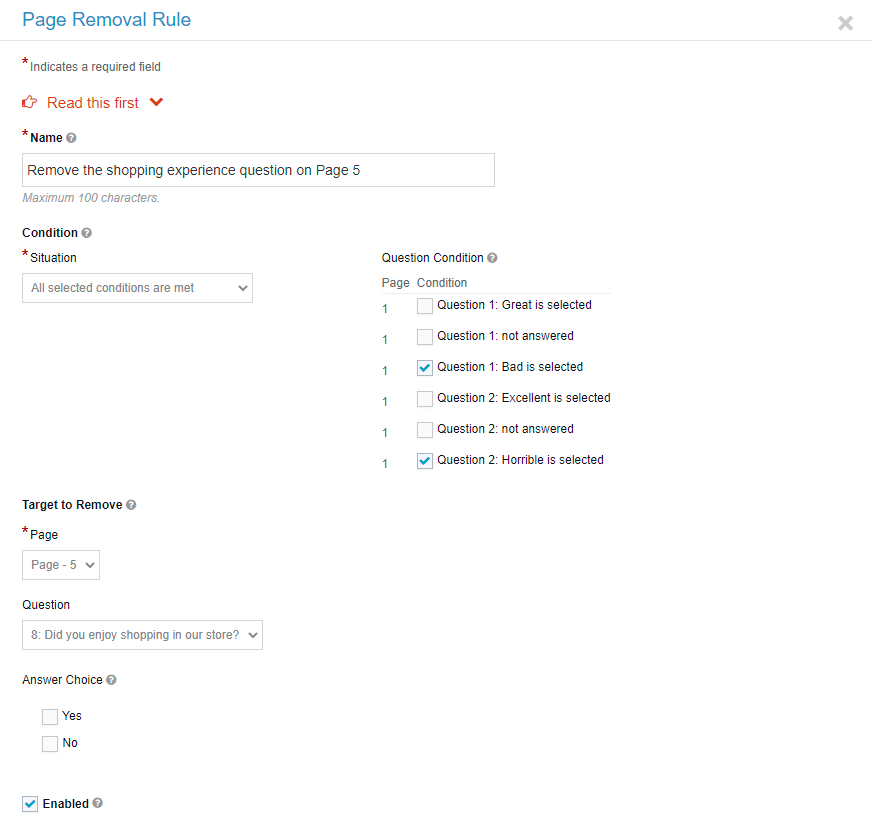
Obviously, it is not necessary to ask this question of a customer who selects Bad for the product question and Horrible for the service question. In this case, this question can be removed from display. You can create two question conditions: one for Bad being selected for the product question and the other for Horrible being selected for the service question. Then you need to create a page removal rule which only removes this question when Page 5 is displayed. All other questions on Page 5 will remain. The process of creating the related question conditions and page removal rule is very similar to what is demonstrated above for skip rules. The following is the screenshot for the page removal rule.
Scoring Rules
We use an example to show how to use scoring rules. Suppose you're running a store and selling two categories of products, Category A and Category B. You carry different products for each category and each product has a different price. For Category A, you have the following three products and prices:
- Product 1, $30
- Product 2, $20
- Product 3, $10
There are also three products for Category B:
- Product 4, $150
- Product 5, $50
- Product 6, $10
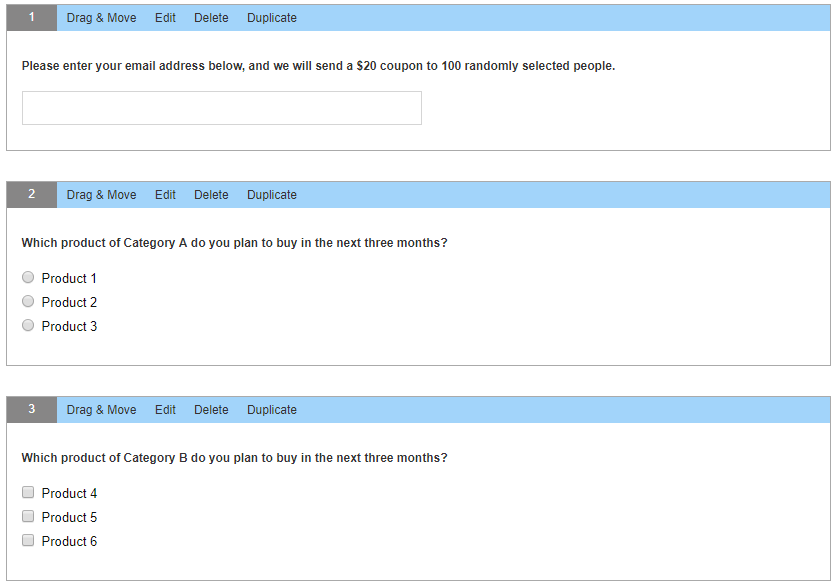
Suppose in this survey, you'd like to find out which people are willing to spend more overall in their next visits to your store. You are also interested in those people who intend to buy Product 4. The following screenshot shows the questions in the survey, and we'll allow people to make multiple selections for the Category B question to show the system's capabilities.
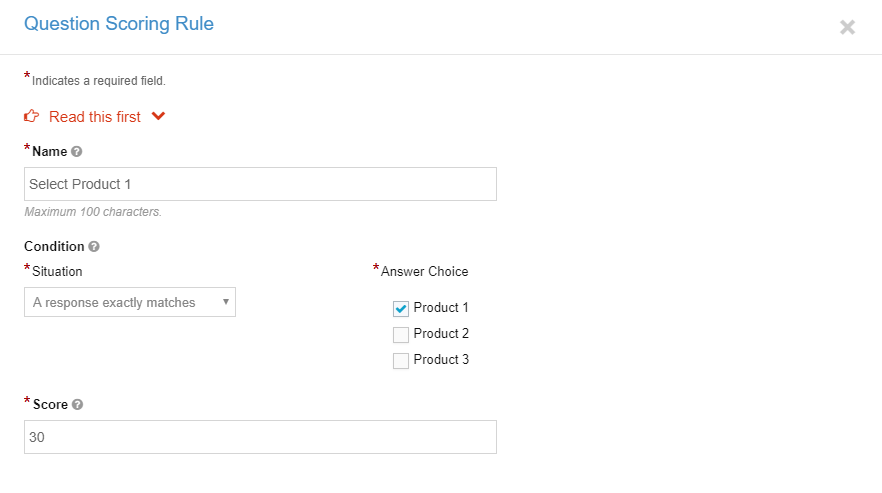
Now you need to add scoring rules to the questions. For the Category A question, you'd like to assign the actual price as the score for each selection, so you create the following scoring rule when a participant selects Product 1:
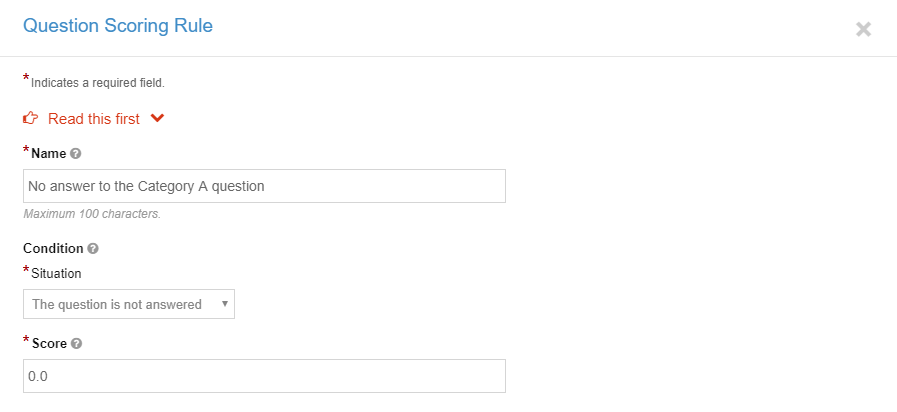
Similarly, you need to add rules for the other two selections. If you want to make sure there's a score for the answers to a question, the scoring rules must cover all possible scenarios. In our case, the Category A question does not require a mandatory answer, so we must add another scoring rule when a participant doesn't select any product for this question. Note that if no rule applies to the answer to a question, then our system does not add any score to the total score of a response. No score for a question or response does not mean zero. It simply means that no applicable scoring rule is found.
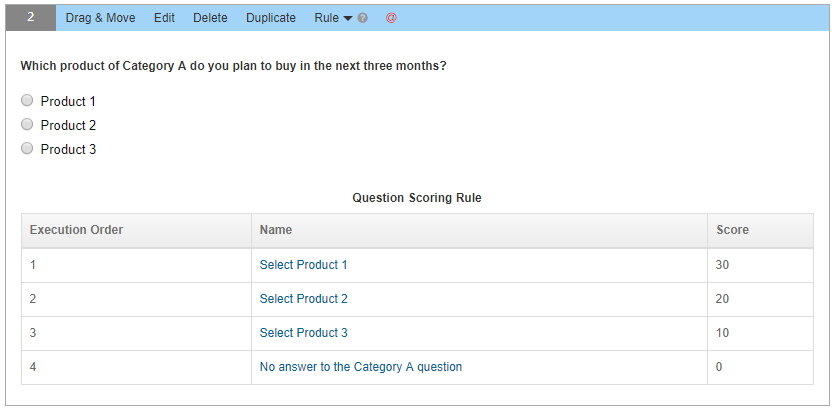
Here are the scoring rules so far for the Category A question:
For the Category B question, you'd like to give a score larger than its price if a participant selects Product 4 (the most expensive one) and a smaller score for Product 6 (the cheapest one). Note that scores can be any number you deem appropriate for your survey, including negative numbers and decimals. Suppose you add the following scoring rules for the Category B question:
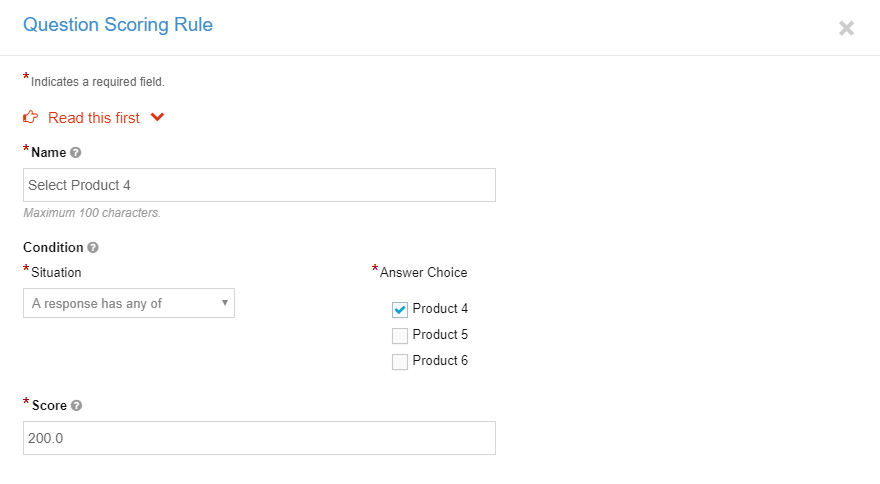

Here are the scoring rules so far for the Category B question:
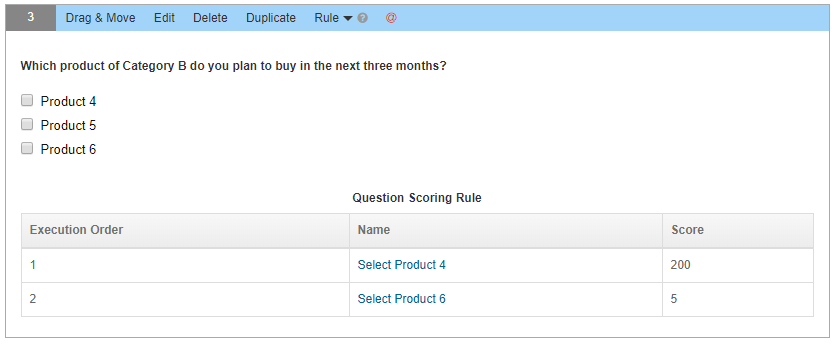
For this question, the sequence of scoring rules is important because it allows for multiple selections. If a participant selects both Products 4 and 6, we'll apply the scoring rule for selecting Product 4. Once this rule is applied, the rule for Product 6 will be ignored. For the Category A question, the sequence of scoring rules has no effect because a participant can only select one product, and there is no overlap of covered scenarios between rules.
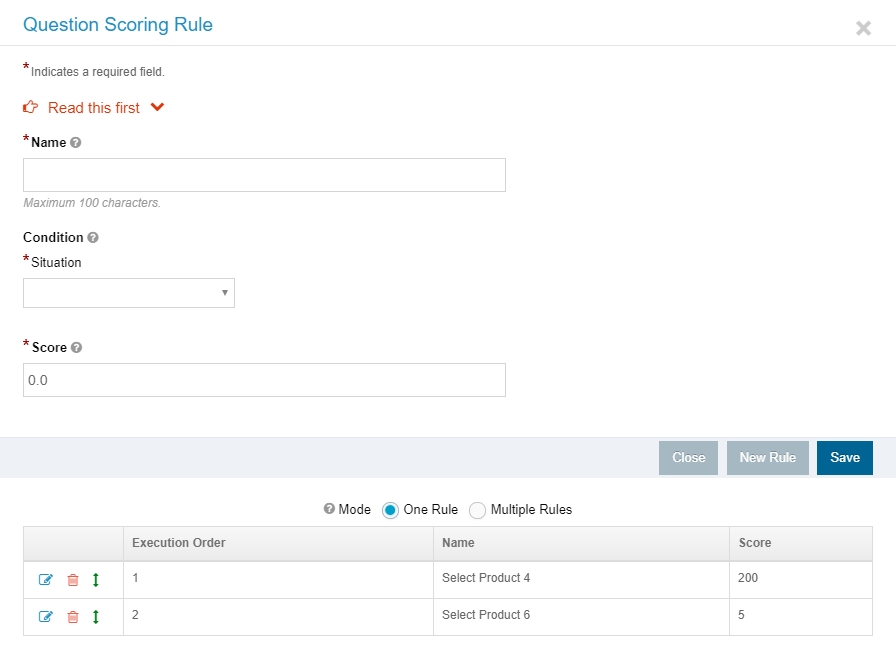
If a question has more than one scoring rule, then its scoring rules can be used in two modes as shown below. The one rule mode works as explained above. In the multiple rules mode, all scoring rules will be tested to find applicable rules. Then, the scores of all applicable scoring rules will be summed to get the total score of the answer to a question. Regarding the question for the Category B products, if the mode was multiple rules and both Product 4 and Product 6 were selected in an answer, then the score on this question would be 205.
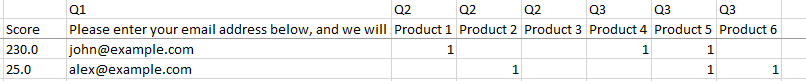
Once participants respond to your survey, you can see the score along with the answer to each question in a response when you download responses. See the following screenshot for an example. This tool can be very helpful if you use it with other analytical tools that we offer.
A Survey in Multiple Languages
We are proud of our strong support for a single survey with multiple languages. The entire system was built with the goal of supporting global users in mind.
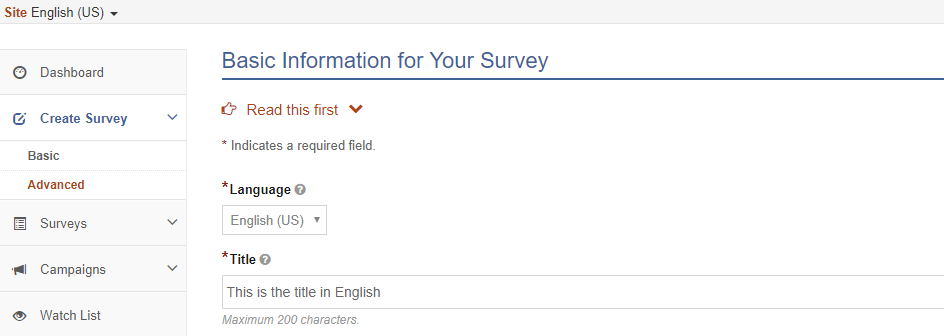
Before you start, you should first know that the site language selection has nothing to do with the multi-language survey. It only determines the language used in the interface of the website. Second, to create a survey with multiple languages, you have to do it in the Advanced mode. When you create your survey, the first language you choose will be considered its default language. Please note that your survey's language determines the interface language participants will see when they take your survey.
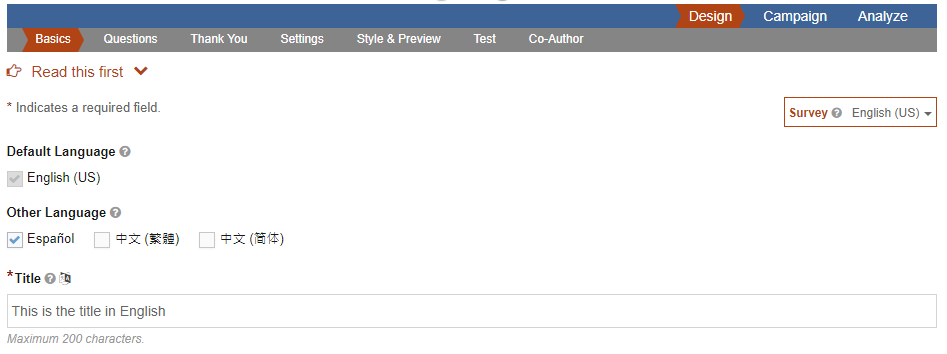
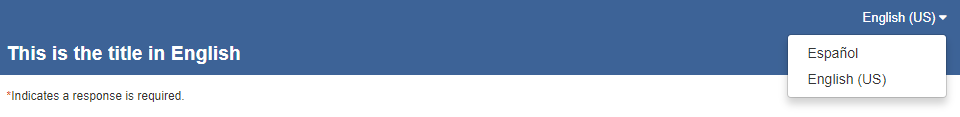
Once your default language is selected and saved, you can add more languages. Suppose we select Spanish and click the Save button. Note that now your survey has a language selection dropdown as shown below:
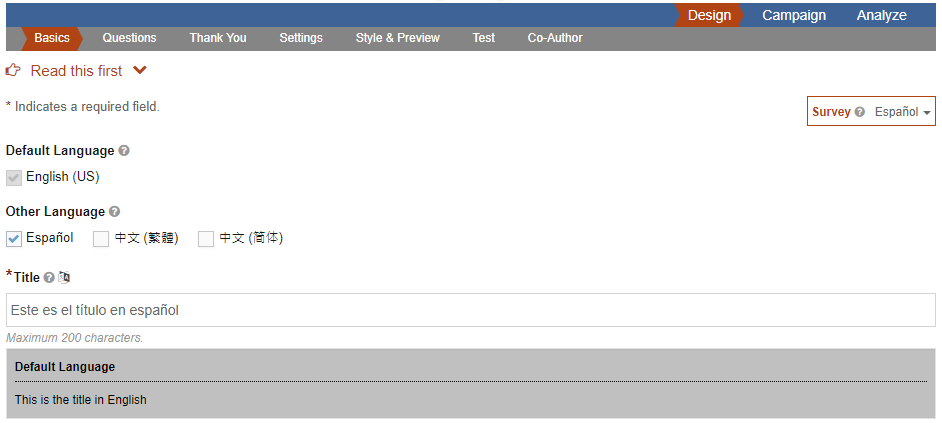
From your survey's language dropdown, you can select the language version to work on. In your case, you can select Spanish to enter Spanish text for the title and other fields. Note that when you work on the version of a non-default language, the version of the default language always displays for your information. See the following screenshot:
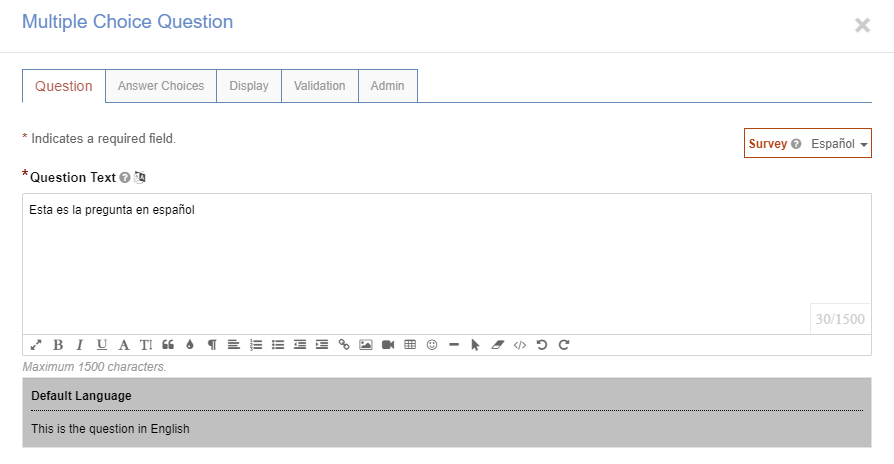
Similarly, you can enter Spanish text for questions, answer choices, etc. The following screenshot is an example:
When you distribute your survey to ask people to take it, you can have a web link for each language version.
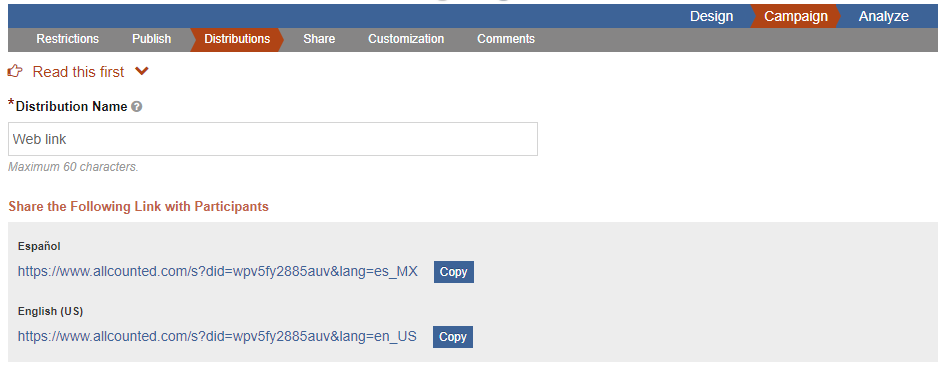
You can send your survey to a group of people with the language version appropriate for them. When they take your survey, they are also able to use the language of their choice (note that this language dropdown can be removed through the Style page).

The best practice for a multi-language survey is to finish the design of the survey in the default language first, and then work on adding additional languages. Please note that if you don't enter text for a language version, the text of the default language will display.
We don't support analysis by language directly. If you want to analyze the results of each language in your survey, you have two options:
- Create a single campaign and multiple distributions, one for each language. That way, you can know how people responded in each language, and you can also know how people responded as a whole.
- Create multiple campaigns, one for each language. For each campaign, you create one distribution. That way, you can know how people responded in each language, and you can also know how people responded as a whole.
An Example Survey for Analysis
In the rest of the guide, we will focus on the analytical tools and use the following example survey to explain and demonstrate these tools. Suppose that you are working on a survey project with two goals:
- Understand the relationship between students' sleep and their academic performance
- See if gender or sports activities play any role
Let's assume that you have the following four questions in your survey:
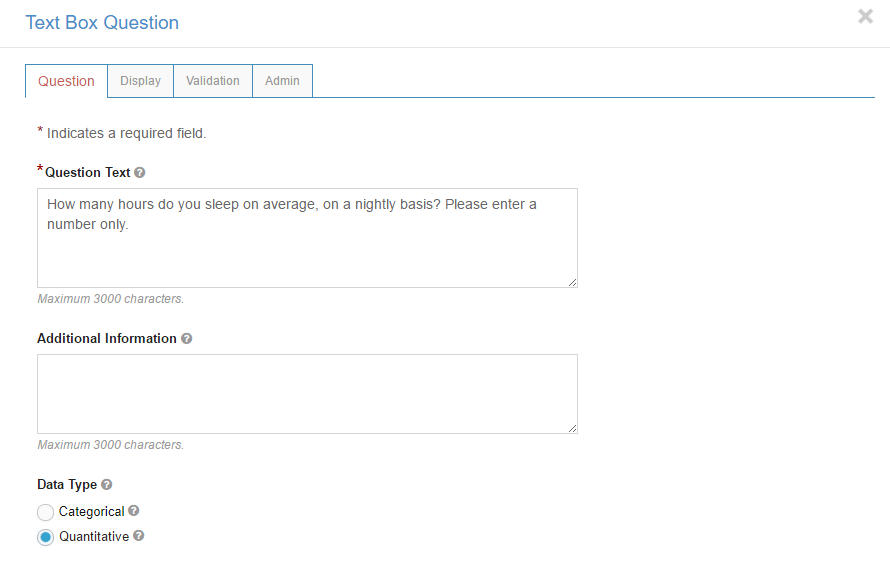
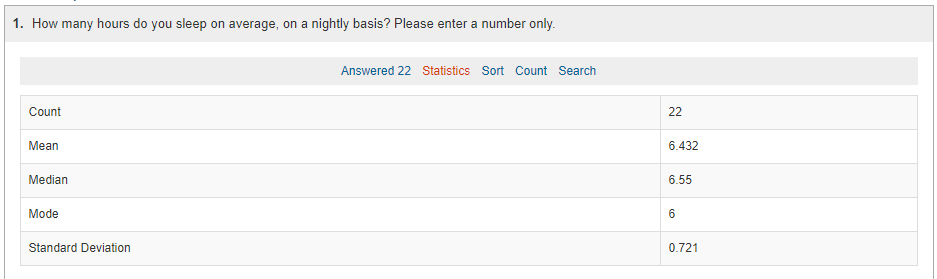
Question 1 How many hours do you sleep on average, on a nightly basis? Please enter a number only.
Question 2 What is your average GPA, on a 4.0 scale? Please enter a number only.
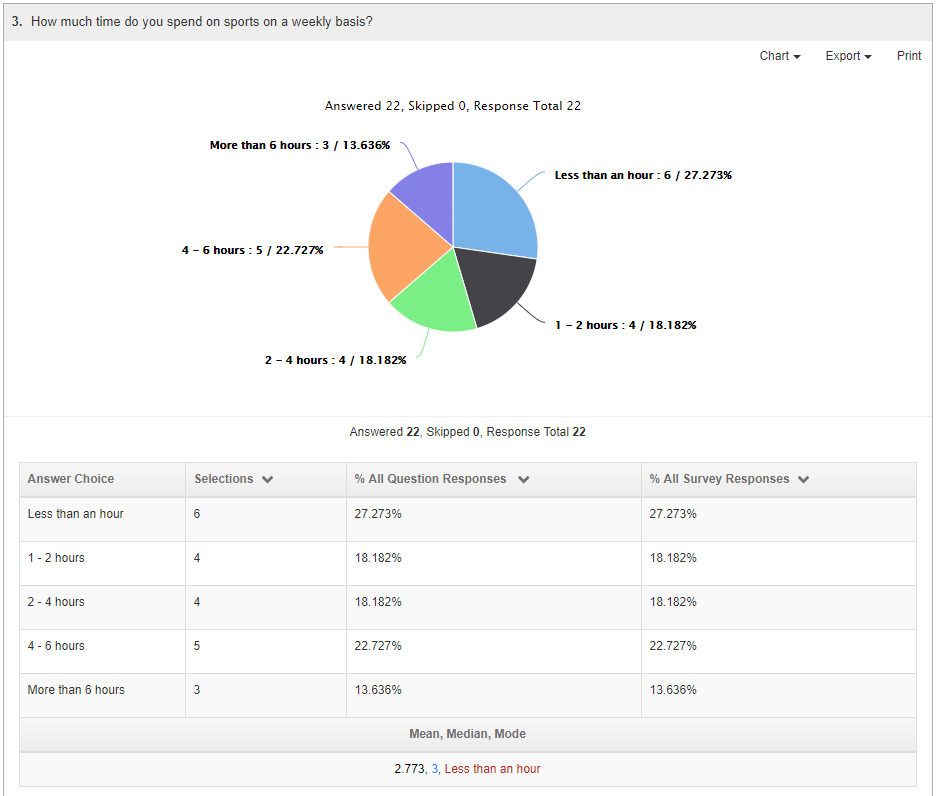
Question 3 How much time do you spend on sports on a weekly basis?
- Less than an hour
- 1 - 2 hours
- 2 - 4 hours
- 4 - 6 hours
- More than 6 hours
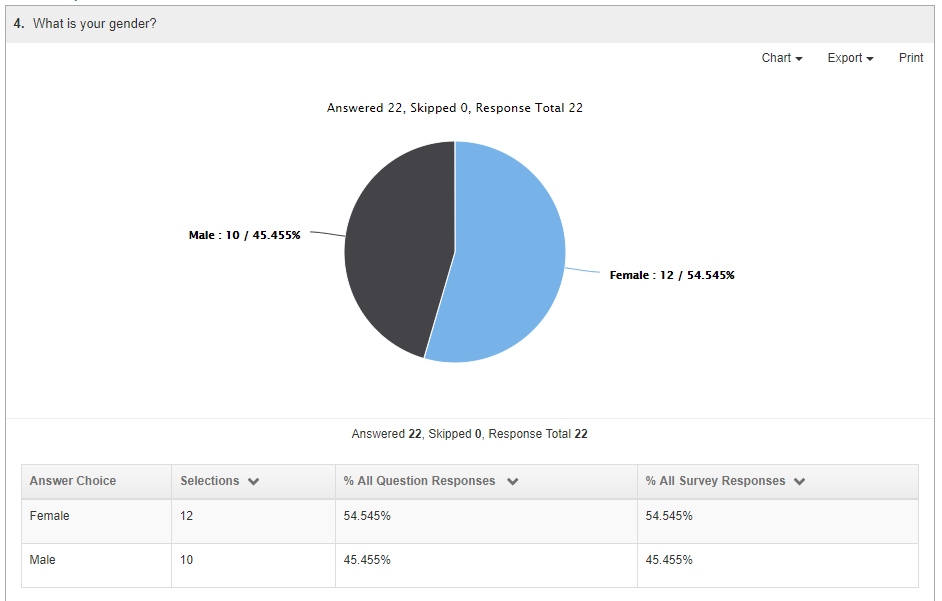
Question 4 What is your gender?
- Female
- Male
Suppose that you'll accomplish the following tasks:
- Create a survey with questions that collect quantitative, categorical, and ordinal data
- Conduct two-way cross tabulation between student gender and time spent playing sports
- Do a student's t test to see if GPA means are statistically different between female and male students
- See if gender and time spent playing sports are associated in any way
- Perform linear and polynomial regression between time spent sleeping and GPA
Questions and Data Types
Each question in a survey collects some data from survey participants. The type of data a question collects determines the analysis available on the question. AllCounted supports three data types:
| Data Type | Example | Analysis |
|---|---|---|
| Categorical | Hair color: Black, Brown, Blonde, etc. | Percentage, cross tabulation, Chi-square test of independence |
| Ordinal | Agreement with an opinion: Strongly agree, Agree, Neutral, Disagree, Strongly disagree | Percentage, mean, median, mode, cross tabulation, Chi-square test of independence |
| Quantitative | Age, income, blood pressure, temperature, number of people in a family, bank account balance, etc. | Mean, median, mode, standard deviation, t tests, ANOVA, linear or polynomial regression |
Ordinal data is a special kind of categorical data. We make this distinction only when needed. Otherwise, they are both referred to as categorical data.
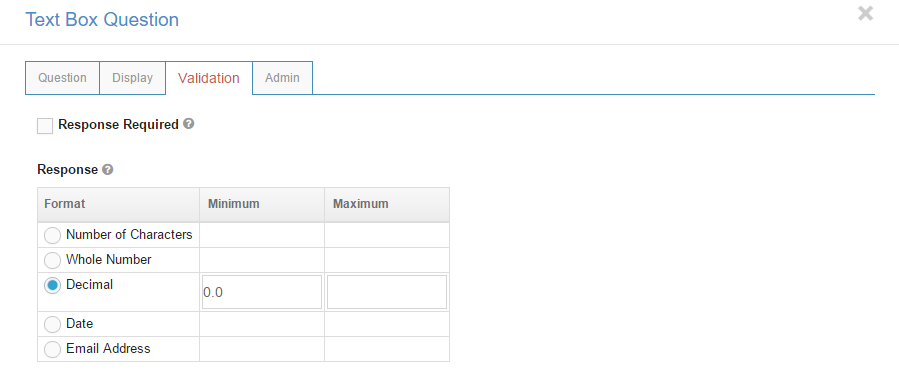
For Questions 1 and 2, you want to collect numbers. To enforce this requirement and make analysis on quantitative data possible, you have to indicate that the data type of these two questions is quantitative. Also, we highly recommend that you use validation to require survey participants to only enter numbers (with or without a range requirement) because invalid data will be excluded in the analysis. See the following two screenshots:
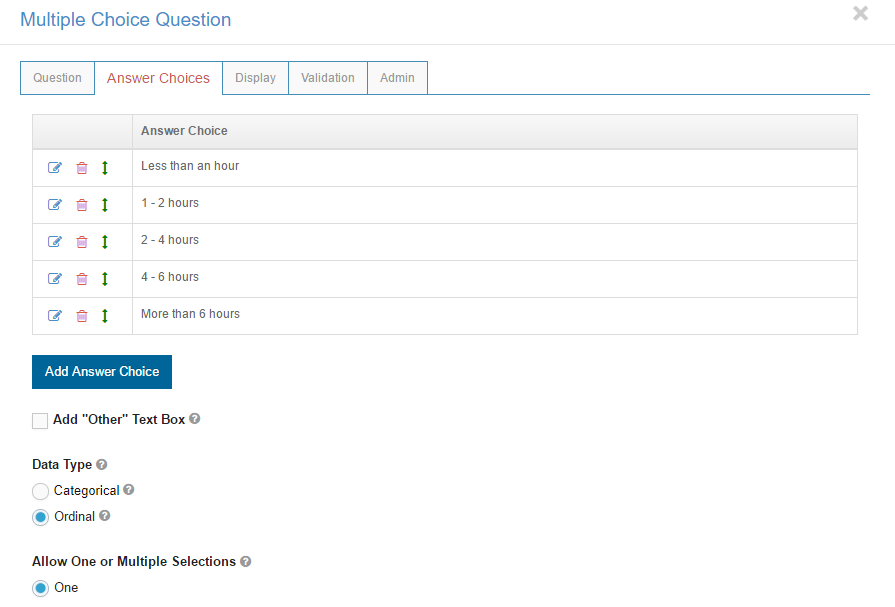
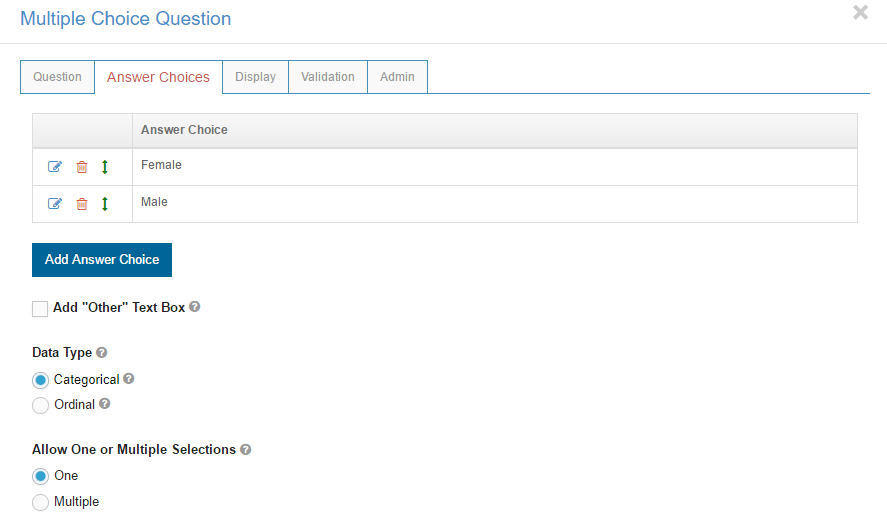
Suppose that you select Ordinal as the data type for Question 3 and Categorical for Question 4. Please see the following two screenshots:
Compare Responses
If you want to compare responses from different groups based on the same set of questions, then you need to create a single survey and collect responses through different campaigns or distributions. Each campaign or distribution counts as one group of responses. You may also separate responses into different groups based on the answer choices of a multiple choice question. In this situation, each answer represents a group of responses, and you don't need to create multiple campaigns or distributions. Note that we are unable to compare responses from two surveys even if their questions are exactly the same.
Analyze Your Survey
Suppose that you have collected enough responses and are ready to perform analysis. Open your survey, click Analyze, Results as shown below:
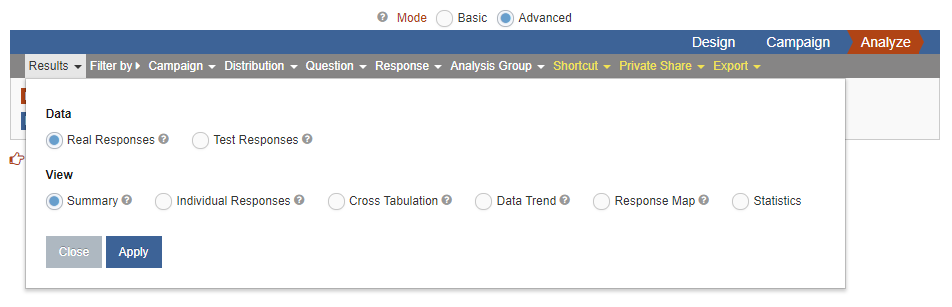
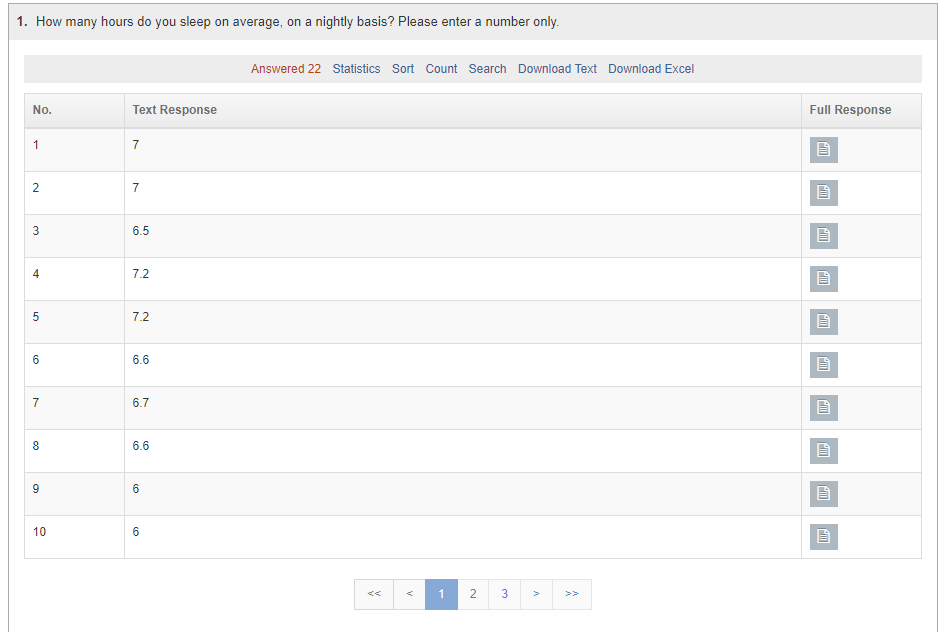
The above screenshot shows the types of responses you can use in analysis and the available analytical tools (under View). You can look at and analyze the responses to your survey in different views. The default and perhaps the most important view is Summary. In the Summary view, we list the text answers to a Text Box question. If the question's data is quantitative, you'll see a Statistics link, which gives you some simple statistics on the responses to your question (Note that you can get many more statistics under the Statistical Analysis view). Please see the following two screenshots:
In the Summary view, for Multiple Choice questions like Question 4, we display the statistics in a chart and table as shown below. The chart and the table have the same information, but the table is helpful if the text is too long to display on the chart.
Question 3 is special because its data is ordinal. In the Summary view, you can see more statistics such as the mean, median, and mode. Please see the following screenshot. Note that we calculate the mean for ordinal data for practical reasons. We automatically assign 1, 2, etc. to the first row (Less than an hour), second row (1 - 2 hours), etc. when calculating these statistics.
Understand Your Data First
Before you go into deeper analysis, it's always good to have a basic understanding of the responses to the question you want to analyze. Another reason to review the responses first is that some statistical tests assume that data has met certain requirements; otherwise, an analysis could be meaningless. For example, student's t tests assume that data is normally distributed. A basic understanding of your data can help prevent this type of error.
For quantitative Text Box questions, we offer a wide range of basic statistics such as quartiles, central tendency, dispersion, and distribution. You can even split the data into a number of groups of equal percentile or find a specific percentile. In addition, you can create histograms or boxplots for quantitative responses. To do this analysis, click Analyze, Results, and then Exploring Quantitative Data under the Statistical Analysis view. You'll be asked to select the variable to analyze. The following two screenshots show this type of analysis on Question 2 (the GPA question).
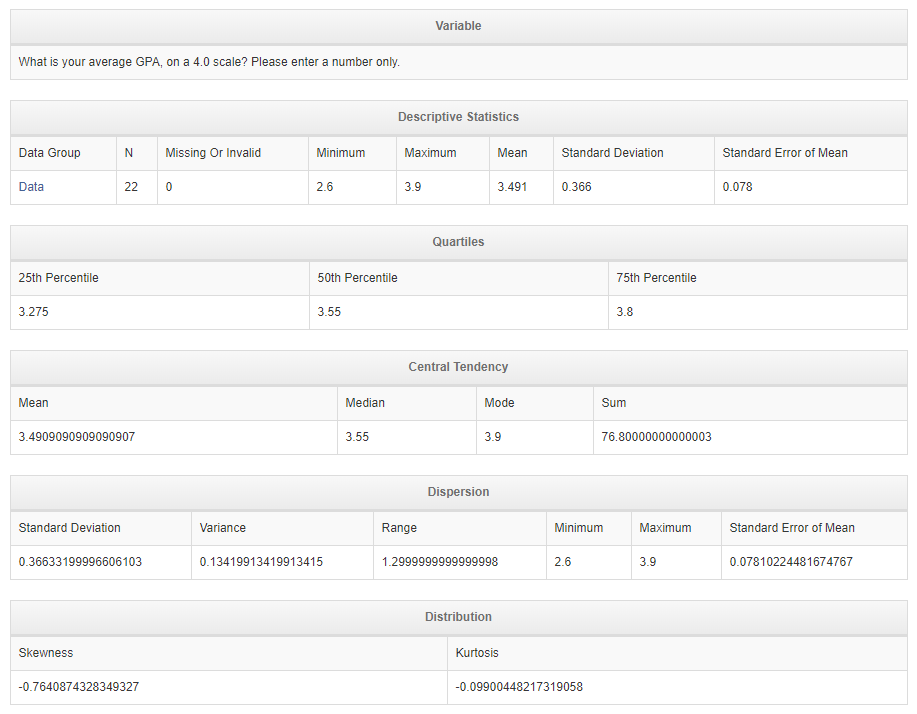
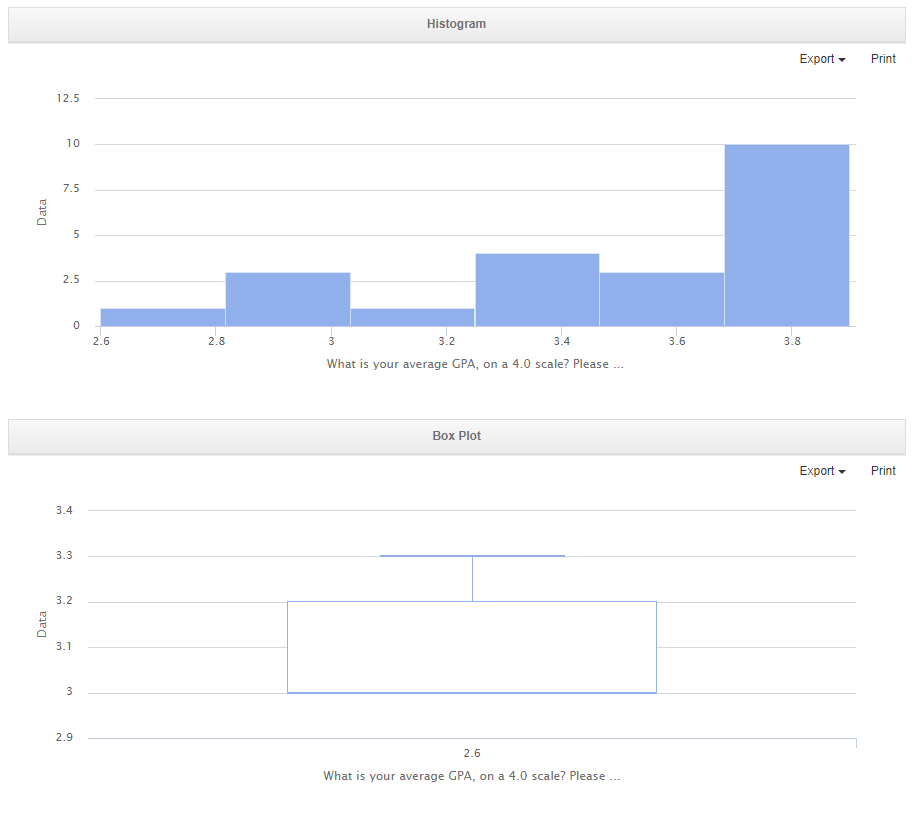
As shown in the above chart, the data on the GPA question should not be normally distributed.
Cross Tabulation
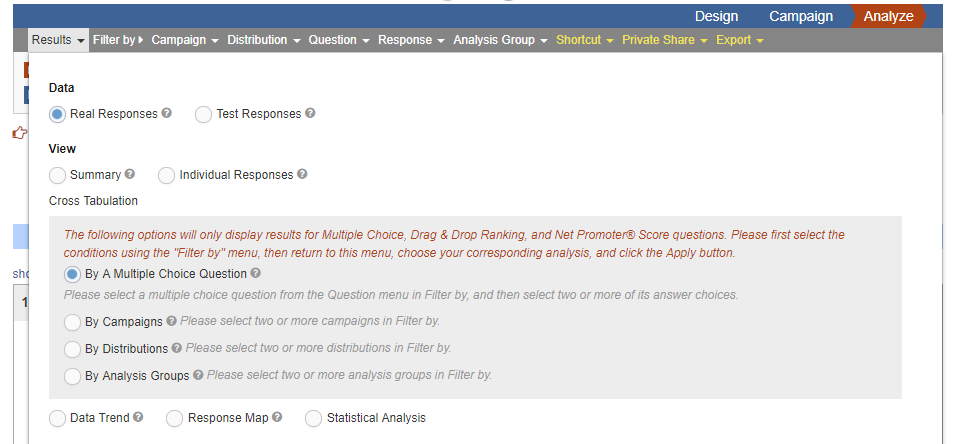
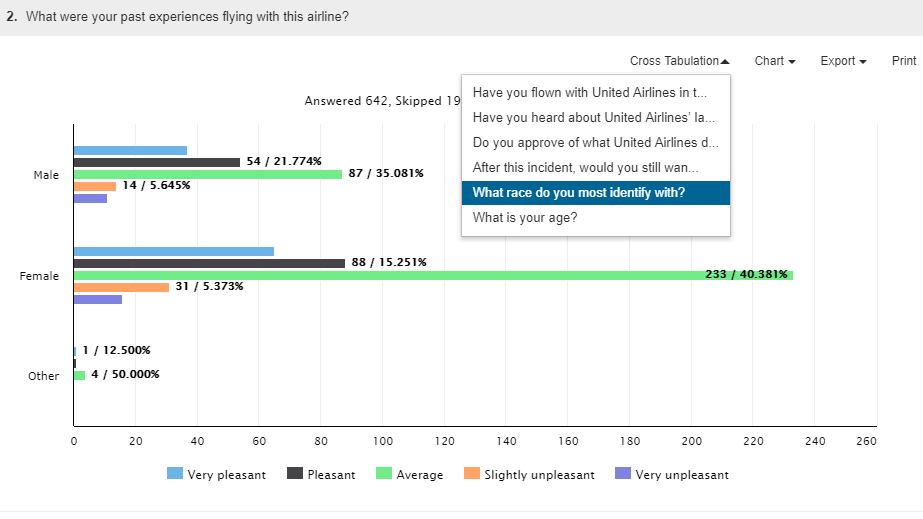
You have four ways to do cross tabulation: by the answer choices of a Multiple Choice question, campaigns, distributions, or analysis groups. Please see the following screenshot:
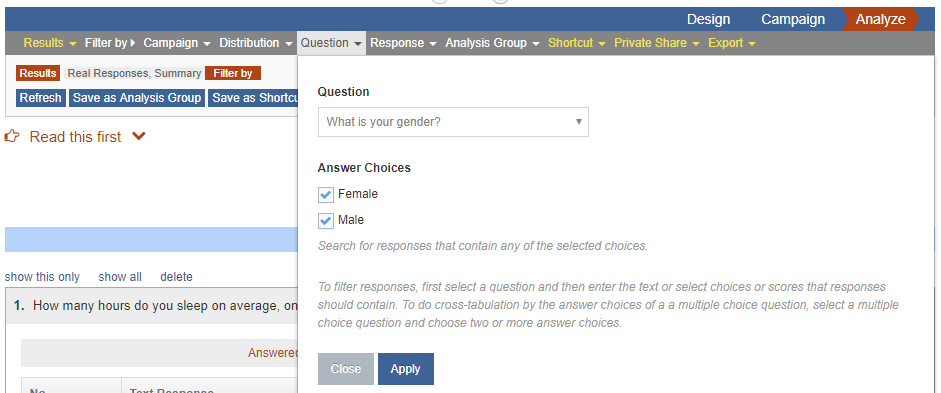
For example, let's select "By a Multiple Choice Question" and click the Apply button. You'll be prompted to select a Multiple Choice question. Click the Question menu and select a Multiple Choice question. Suppose we selected Question 4 and its two answer choices, as shown below:
Click the Apply button, and you'll see the data separated by the answer choices of the selected Multiple Choice question.
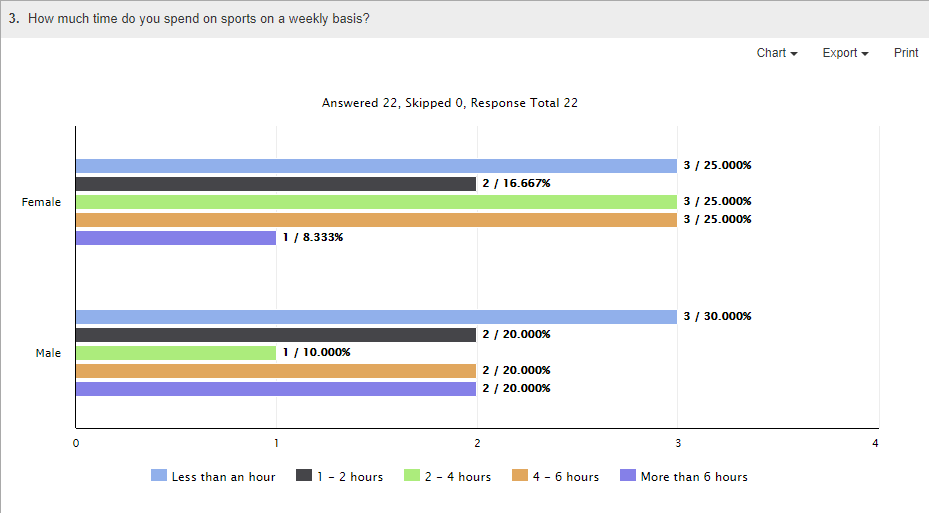
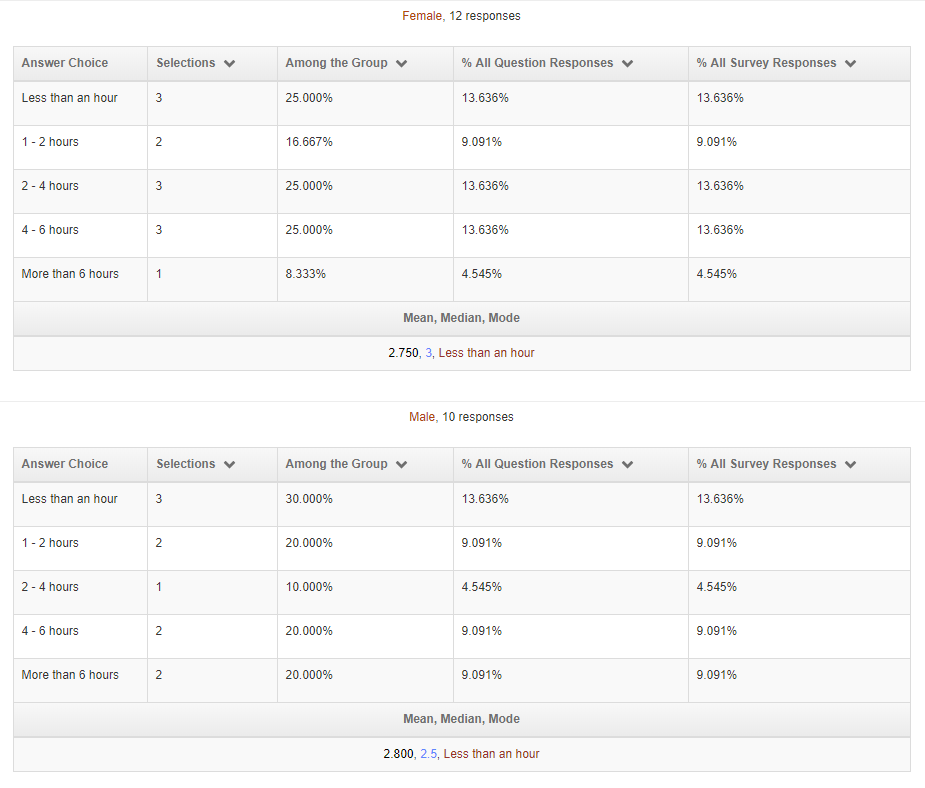
The data in the above screenshot is equivalent to the following two tables (the second table is only applicable to Multiple Choice questions with the ordinal data type):
| Less than an hour | 1 - 2 hours | 2 - 4 hours | 4 - 6 hours | More than 6 hours | |
|---|---|---|---|---|---|
| Female | 3, 25.000%, 13.636%, 13.636% | 2, 16.667%, 9.091%, 9.091% | 3, 25.000%, 13.636%, 13.636% | 3, 25.000%, 13.636%, 13.636% | 1, 8.333%, 4.545%, 4.545% |
| Male | 3, 30.000%, 13.636%, 13.636% | 2, 20.000%, 9.091%, 9.091% | 1, 10.000%, 4.545%, 4.545% | 2, 20.000%, 9.091%, 9.091% | 2, 20.000%, 9.091%, 9.091% |
| Mean, Median, Mode | |
|---|---|
| Female | 2.750, 3, Less than an hour |
| Male | 2.800, 2.5, Less than an hour |
If the data type of a Text Box question is quantitative, then you'll see how its data differs between answer choices. The following screenshot shows how the data of Question 1 varies depending on the answer choices of Question 4.
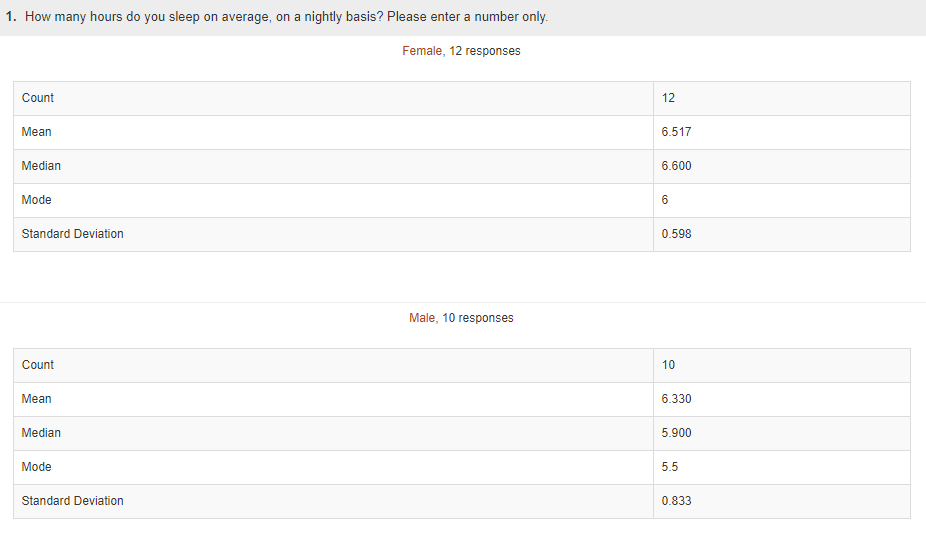
The data in the above screenshot is equivalent to the following table:
| Mean of Sleep Hours | |
|---|---|
| Female | 6.517 |
| Male | 6.330 |
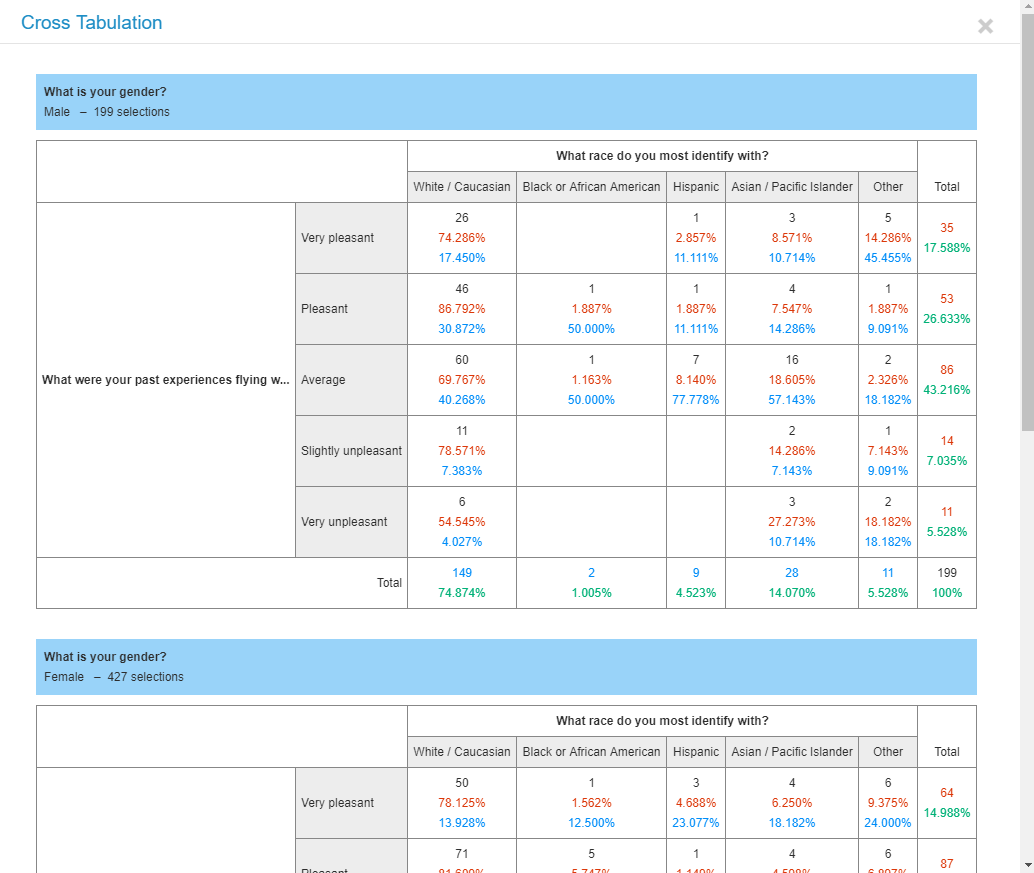
When a two-way cross tabulation is set up, you can conduct a three-way cross tabulation by adding another multiple choice question. The following screenshots are an example.
Independent Samples Student's T Test
Student's t test is commonly used to compare the means from different groups of responses. We support one sample, independent samples, and paired samples student's t tests. In this guide, we use the independent samples t test as an example. Suppose that the data on the GPA question is normally distributed and that you want to know whether the difference in GPA means between female and male students is statistically significant. Click Independent Samples Student's T Test under the Statistical Analysis view, and then click the Apply button. You'll be asked to select the variable and data groups. Here are our selections for this demo:
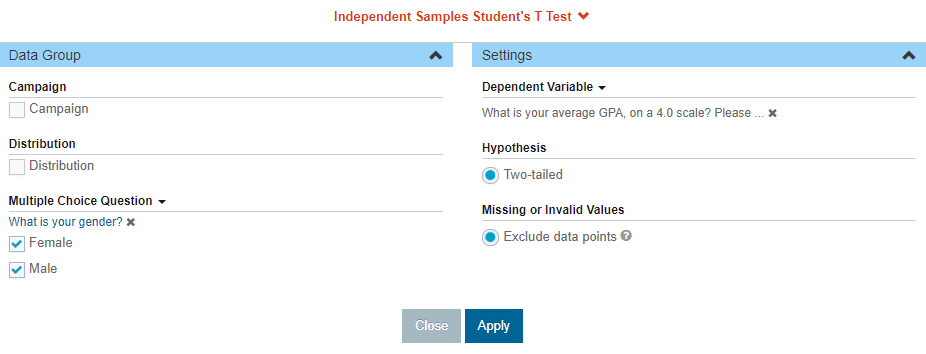
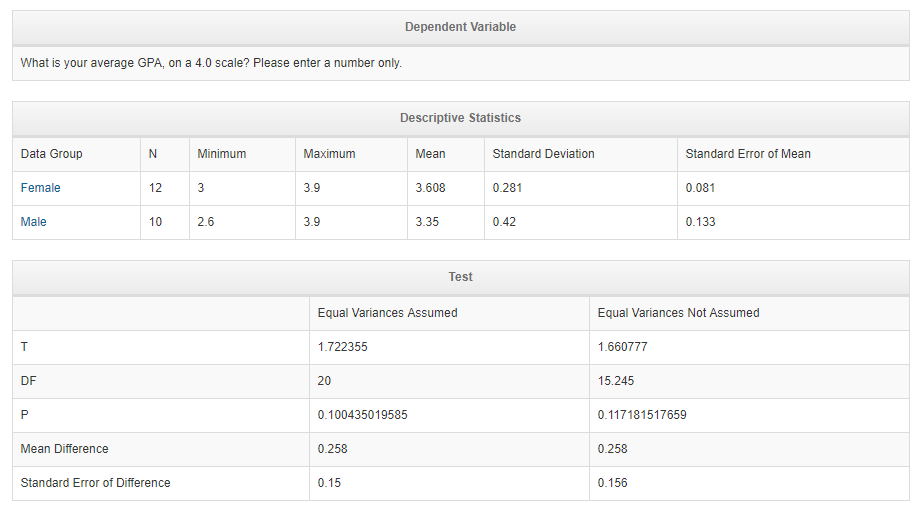
The following screenshot shows the results, which indicate that the difference in GPA means is not statistically significant.
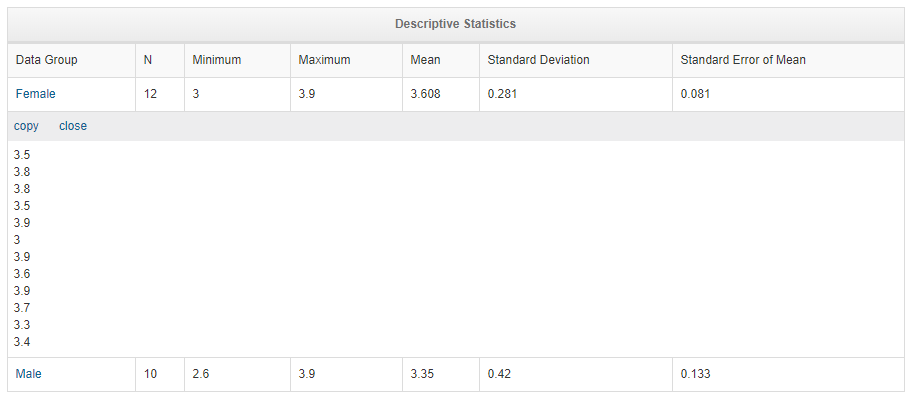
Here is a neat feature for survey creators. If you'd like to export the data points in this test and put them in another analytical tool, you can click on the name of a data group to show all the data points and copy all of them with a mouse click. This feature is available in most of the statistical tools we offer. The following screenshot is an example:
It is worth noting that for the two data groups in this test, you can also select two campaigns, two distributions, or two analysis groups. This applies to all the statistical tools that need two or more data groups. Besides, you can always use the Filters to further segment responses into the dataset you'd like.
Chi-Square Test of Independence
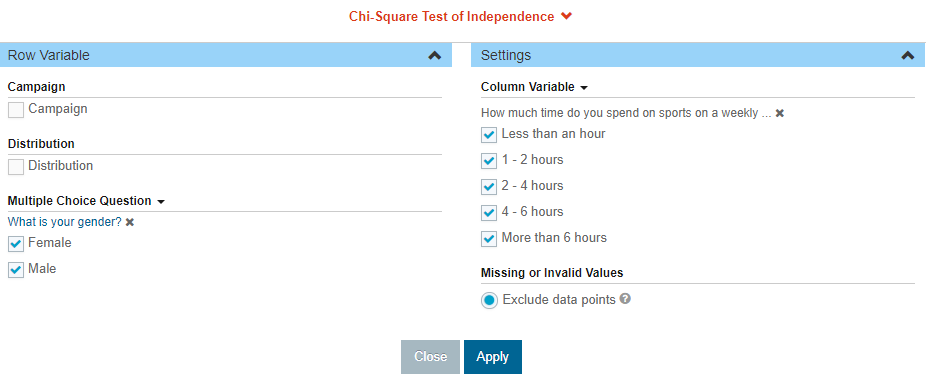
To conduct a Chi-square test of independence, you need to have two categorical variables. In our example, the gender and time spent playing sports questions meet this requirement. Click Chi-Square Test of Independence under the Statistical Analysis view, then click the Apply button. You'll be asked to select the variables. Here are our selections for this demo:
The following screenshot shows the results based on the above settings:
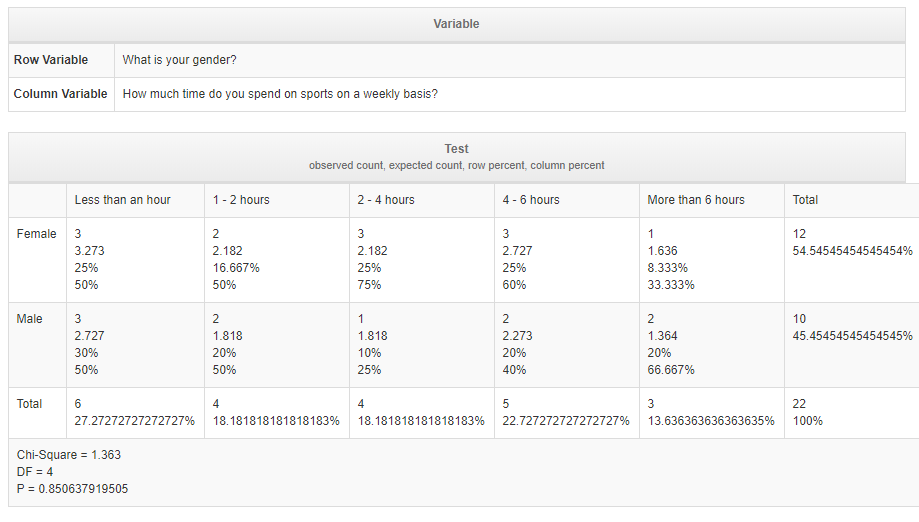
Note that in this test, you are not asked to select any data group. This means that you have only one group, which is defined by your "Filter by" settings. For this and all other tests we offer, you can always use filters to slice and dice data, and the results will be updated instantly.
One-Way ANOVA
Doing one-way ANOVA is similar to doing an independent samples t test. The only difference is that you can select only two data groups for the t test, but you can select more than two groups in the one-way ANOVA test. To do one-way ANOVA, click One-Way ANOVA under the Statistical Analysis view, then click the Apply button. You'll be prompted to select two or more data groups and the dependent variable. The following two screenshots show our selections in this demo and the results:
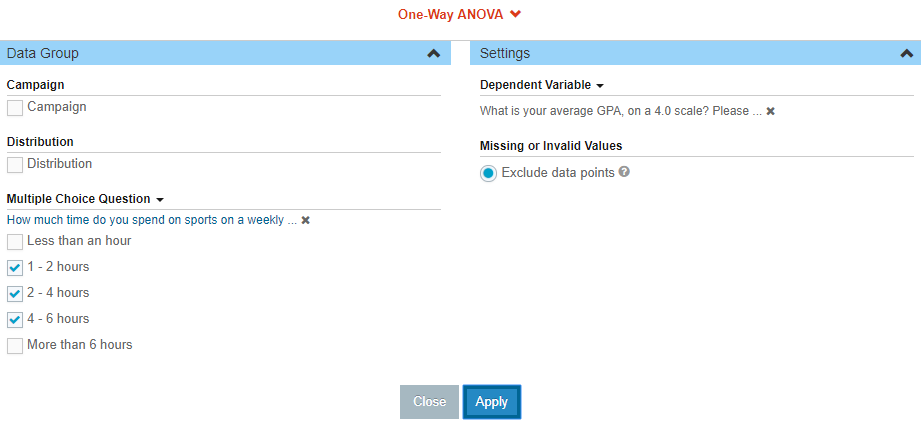
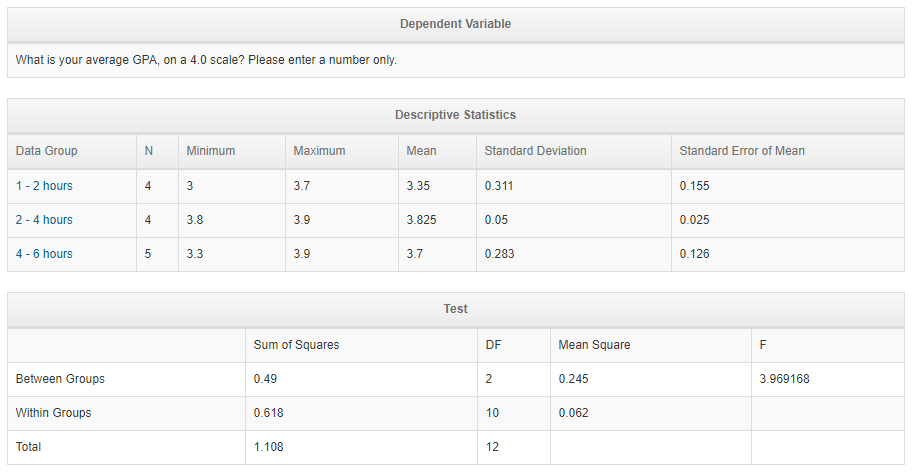
Note that our system is very flexible and you can select two or more answer choices to form the data groups needed for this test.
Regression
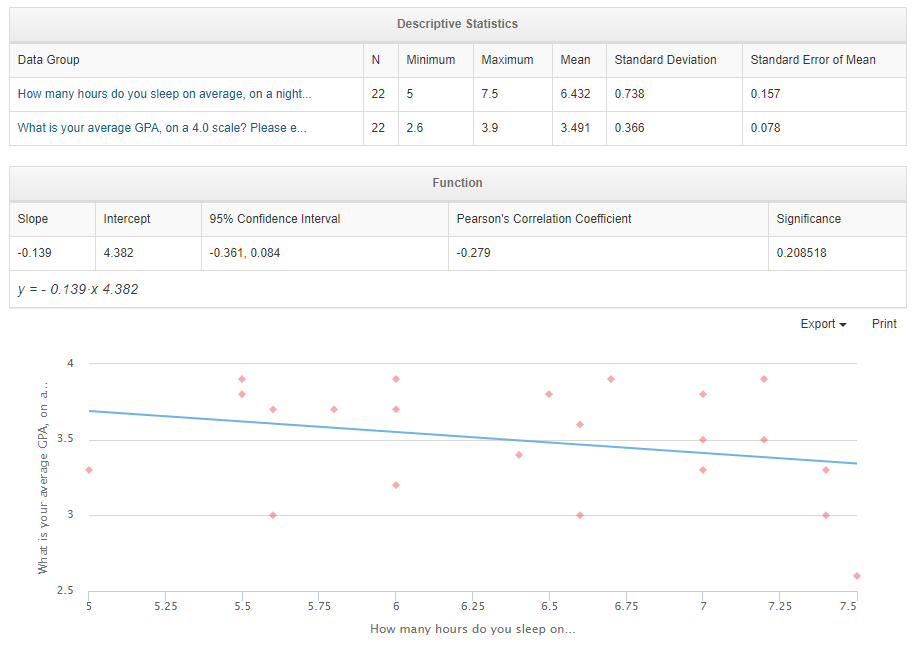
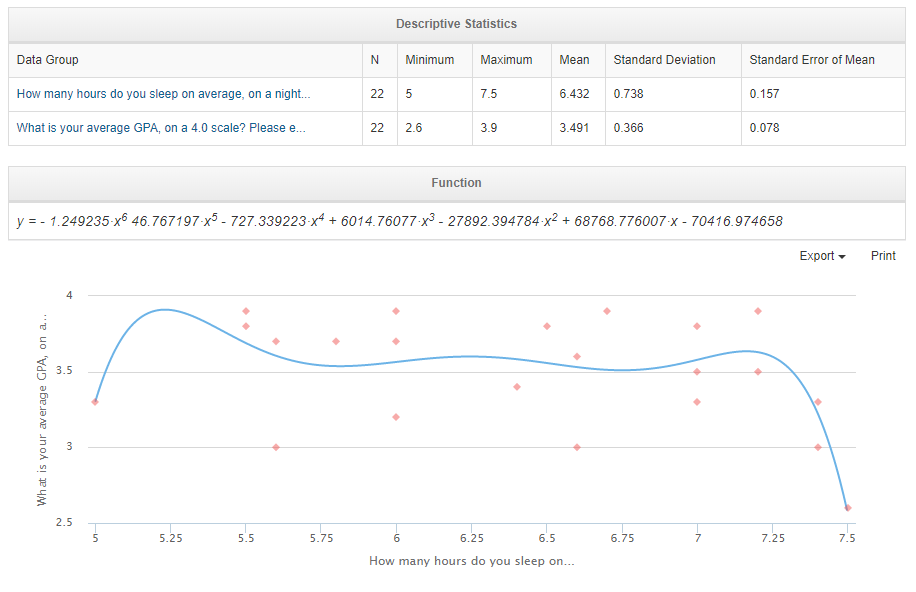
Regression can be performed between two Text Box questions with the quantitative data type. Suppose that you need to perform regression analysis between Questions 1 and 2. You can select Simple Linear Regression or Polynomial Regression under the Statistical Analysis view and click the Apply button. You'll be prompted to select the independent and dependent variables. Let's select Question 1 as the independent variable. Click the Apply button, and you'll get the following table, function, and chart:
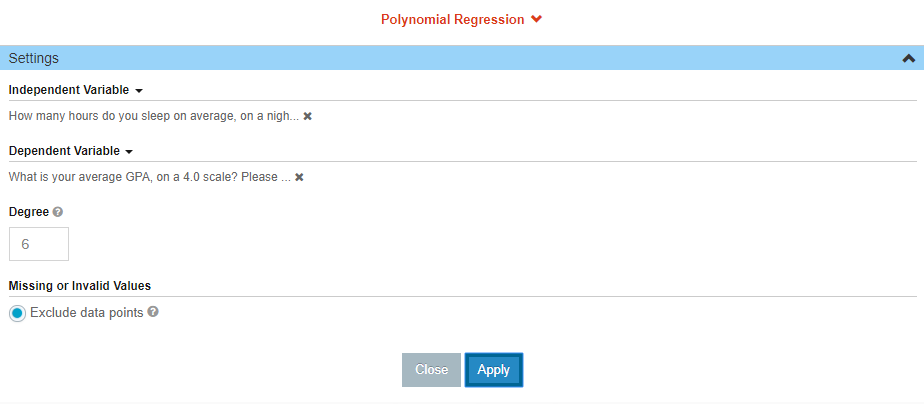
For polynomial regression, you can optionally specify the degree of the fitting polynomial function. You may enter a number between 1 and 20 for the degree. The higher the degree, the more time it'll take to produce the regression function and chart. If you don't select the degree, we'll use 2 by default. The following screenshot shows this:
Data Export
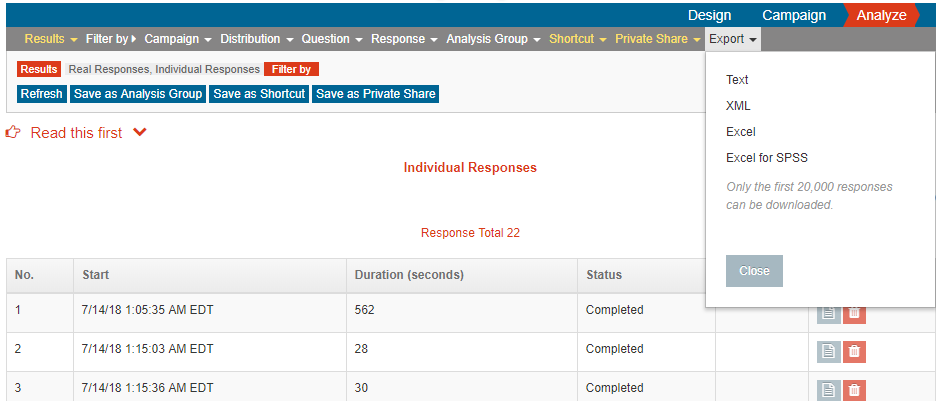
If our analytical tools can't satisfy your needs, you can export all or some of your survey responses into a text, XML, or Excel file. Click the Results menu, select Individual Responses, and click the Apply button, which will display a list of individual responses. Then, click the Export menu and select the download format. The download will start immediately. Please note that if you have a lot of responses, the download may take a while. The good news is that you can leave the download window open and start another browser window to continue using our website without waiting for the download to finish.
As mentioned above, in statistical tools, you can click the name of a data group and export all the data points used in a test.
We Can Help
We offer many powerful and innovative tools and services for online surveys, and they are completely free. You need to sign up to use them. If you have any questions, suggestions, or see something that's unclear, missing, or incorrect, please don't hesitate to contact us. We will do our best to serve your needs in a timely manner.
If your colleagues, friends, or classmates need a tool for online surveys, please let them know that we can help. Thank you!